Free CompTIA DataX DY0-001 Actual Exam Questions
Dumps Box (DumpsBox) offers up-to-date practice exam questions for DY0-001 certification exam which are developed and validated by CompTIA subject domain experts certified in CompTIA DataX DY0-001 . These practice questions are update regularly as we keep an eye on any recent changes in DY0-001 syllabus, and when there is update our team quickly adjusts the questions. This commitment to providing the best quality exam prep material to certification aspirants is what makes DumpsBox.com the best certification exam prep website. On top of that, our strong, yet strictly moderated, community based feedback keeps the content clean and current. Each question has helpful community discussion that provides it extra perspective and introduces helpful resources for better exam preparation. This also saves students from other outdated practice questions or illicit exam dumps that can have adverse affects on career. Browse through our CompTIA DataX DY0-001 exam questions and pass your exam on first try.
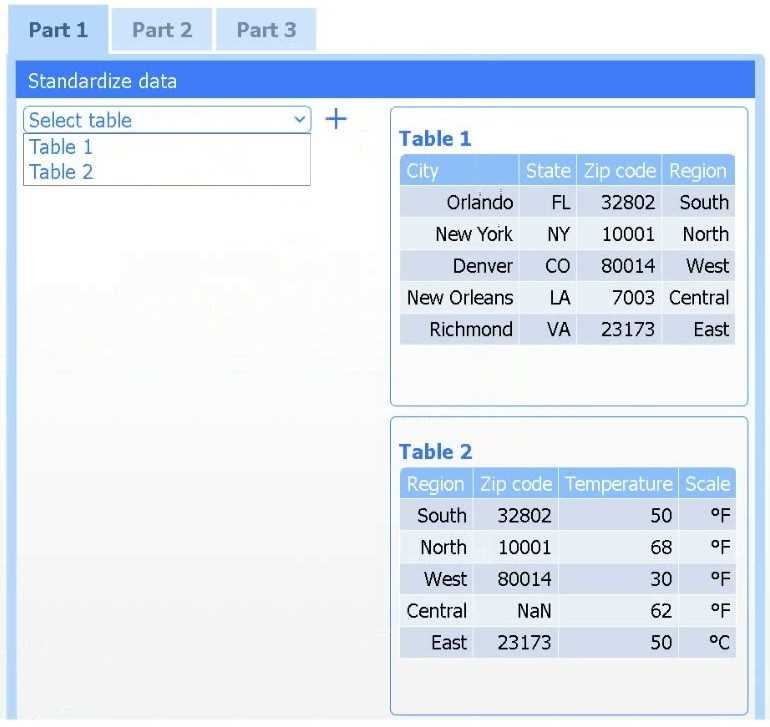
SIMULATION
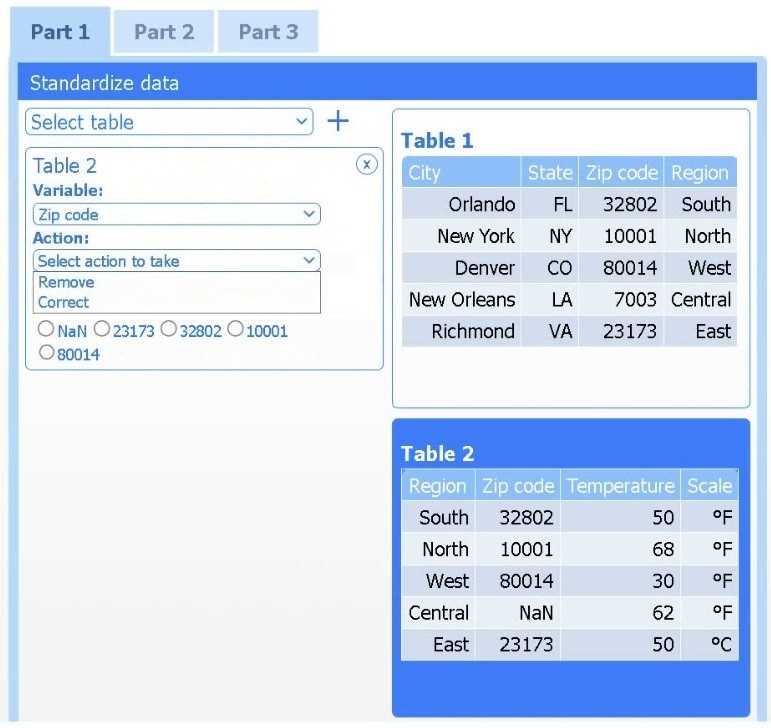
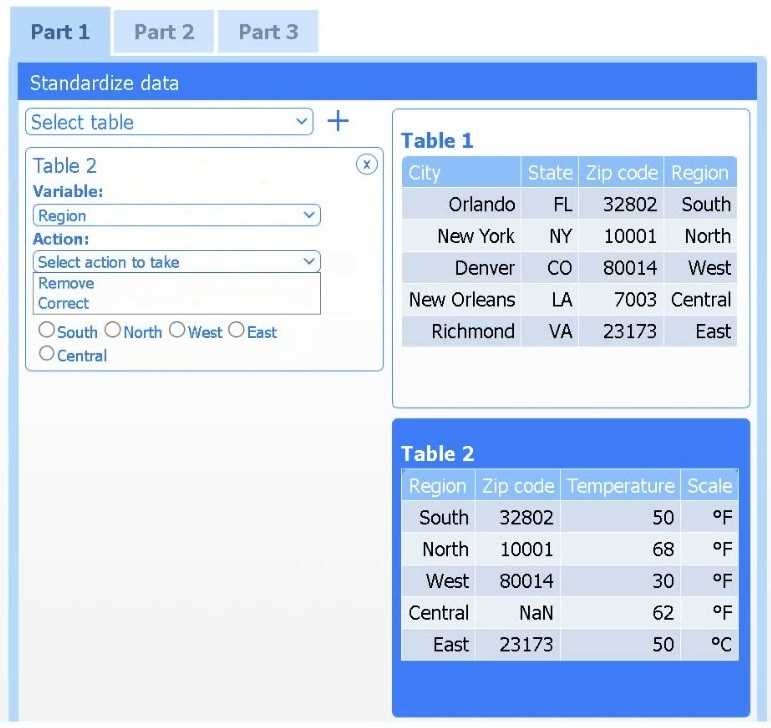
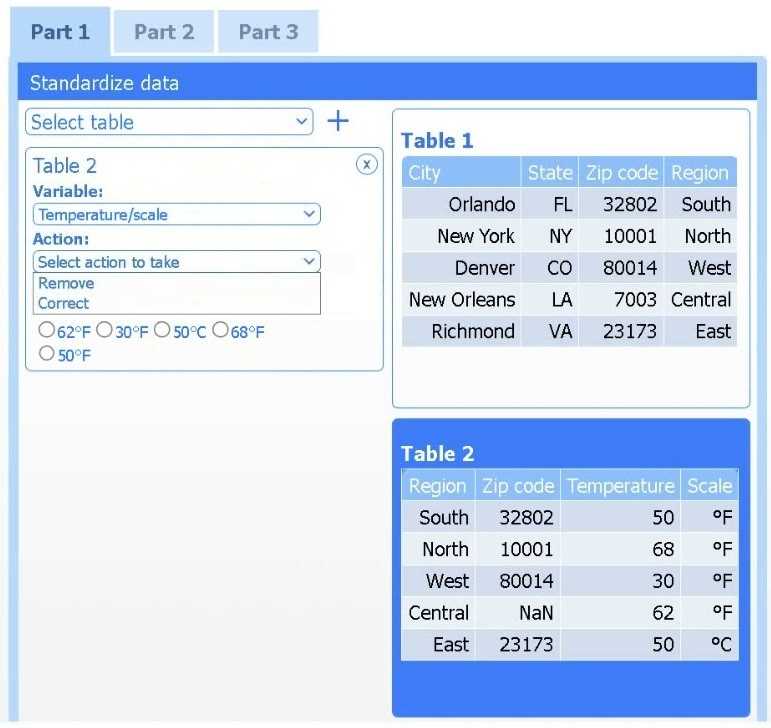
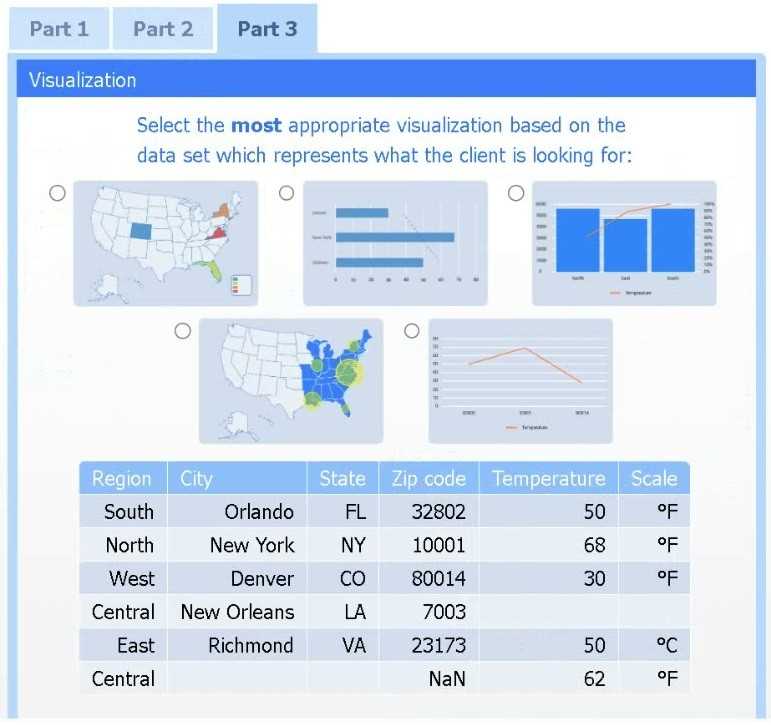
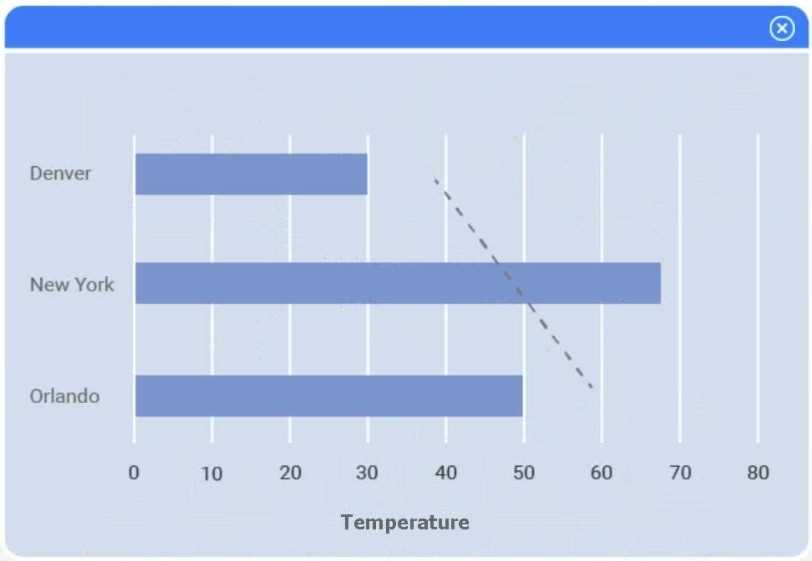
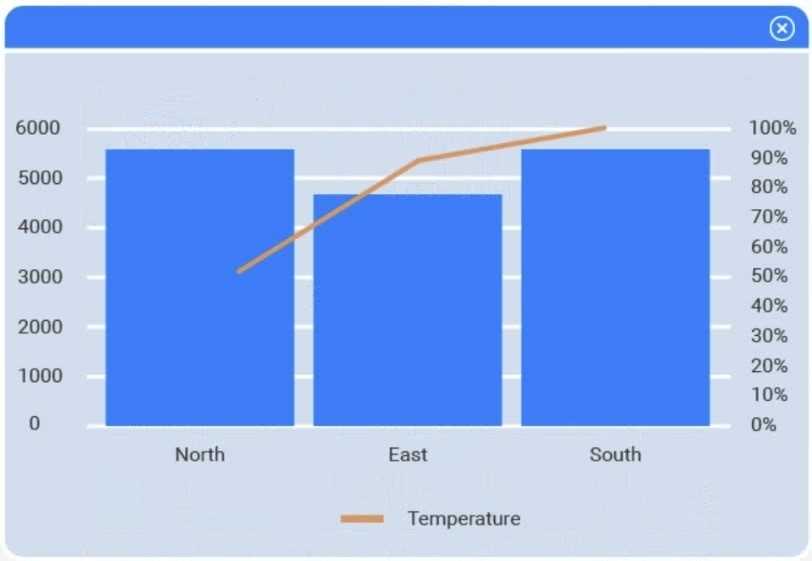
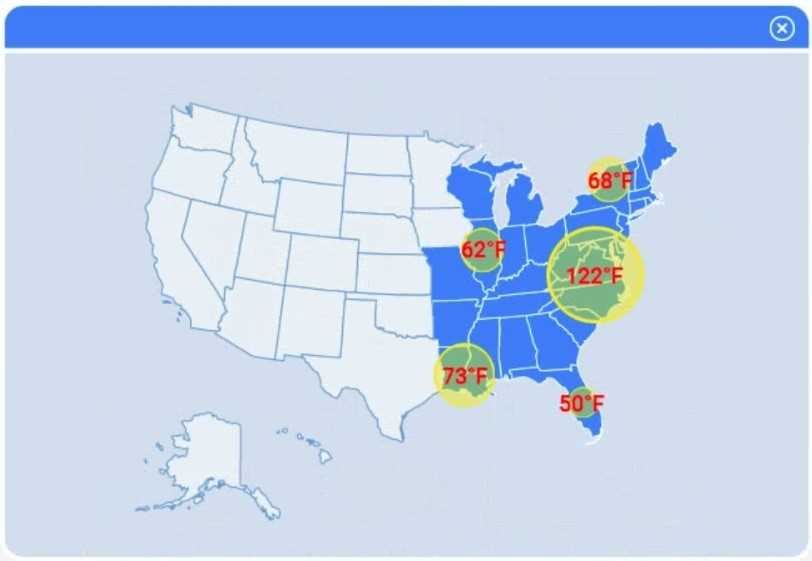
A client has gathered weather data on which regions have high temperatures. The client would like a visualization to gain a better understanding of the data.
INSTRUCTIONS
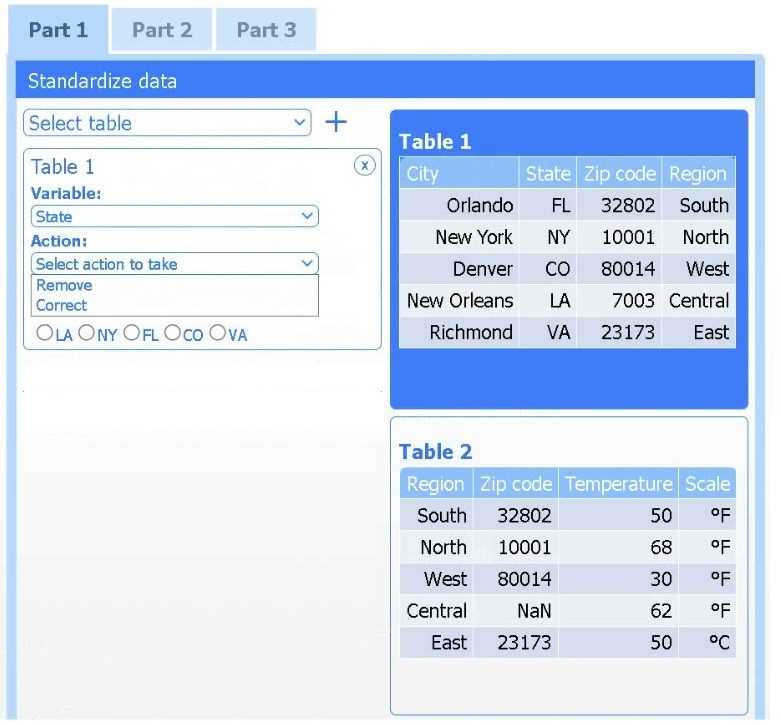
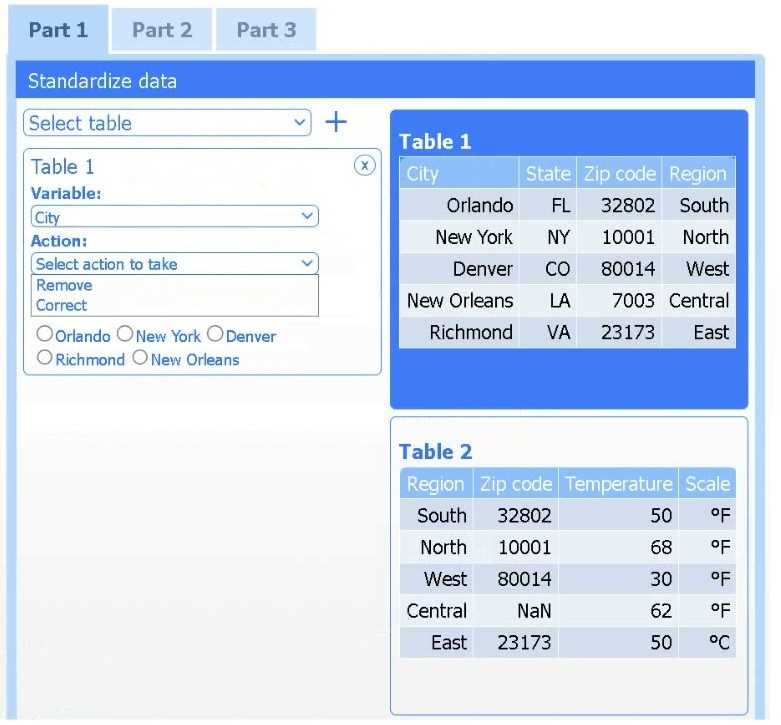
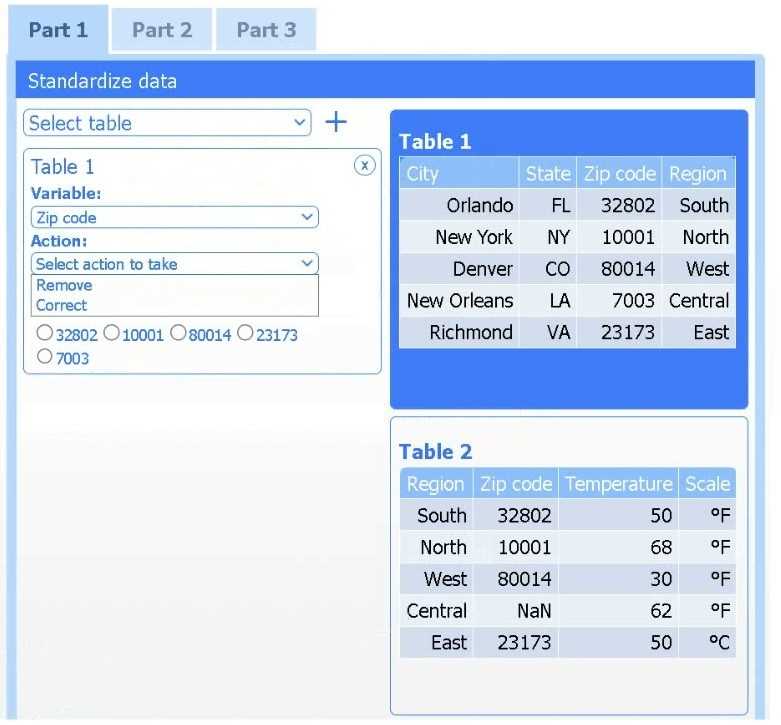
Part 1
Review the charts provided and use the drop-down menu to select the most appropriate way to standardize the data.
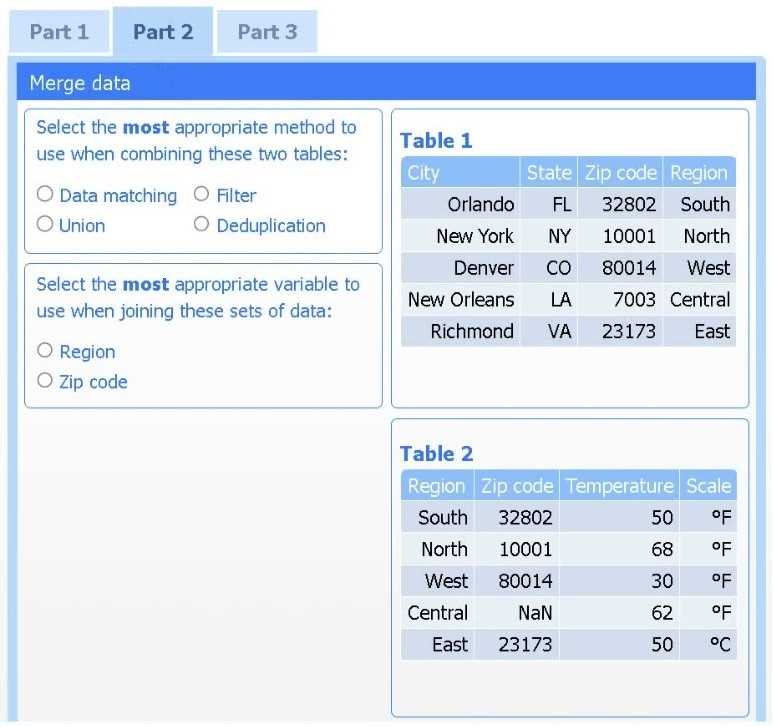
Part 2
Answer the questions to determine how to create one data set.
Part 3
Select the most appropriate visualization based on the data set that represents what the client is looking for.
If at any time you would like to bring back the initial state of the simulation, please click the Reset All button.


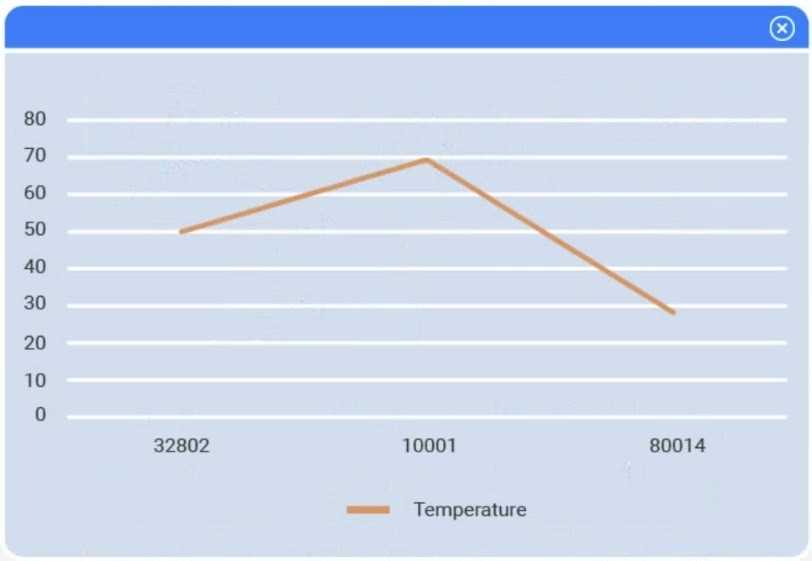
I think option D, percentile rank, could work since it shows relative standing without being skewed by extreme highs. That might help the client see which regions are truly hotter compared to others.
I’d exclude min-max (B) since it can squash data too tightly when there are extreme values, making differences less clear. Z-score (C) keeps the spread and highlights which regions really stand out.
SIMULATION
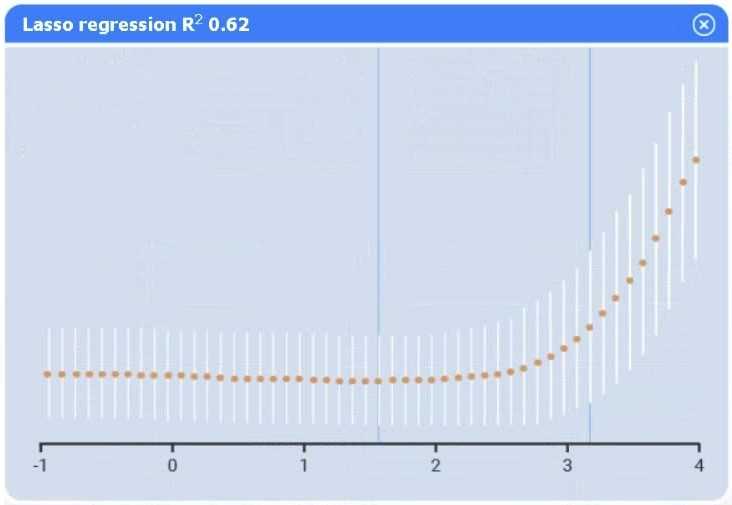
A data scientist needs to determine whether product sales are impacted by other contributing factors. The client has provided the data scientist with sales and other variables in the data set. The data scientist decides to test potential models that include other information.
INSTRUCTIONS
Part 1
Use the information provided in the table to select the appropriate regression model.
Part 2
Review the summary output and variable table to determine which variable is statistically significant.
If at any time you would like to bring back the initial state of the simulation, please click the Reset All button.
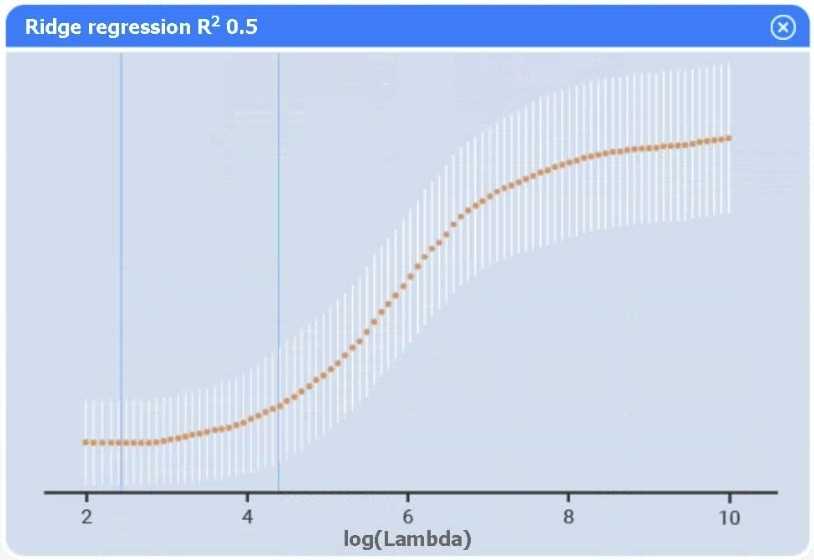
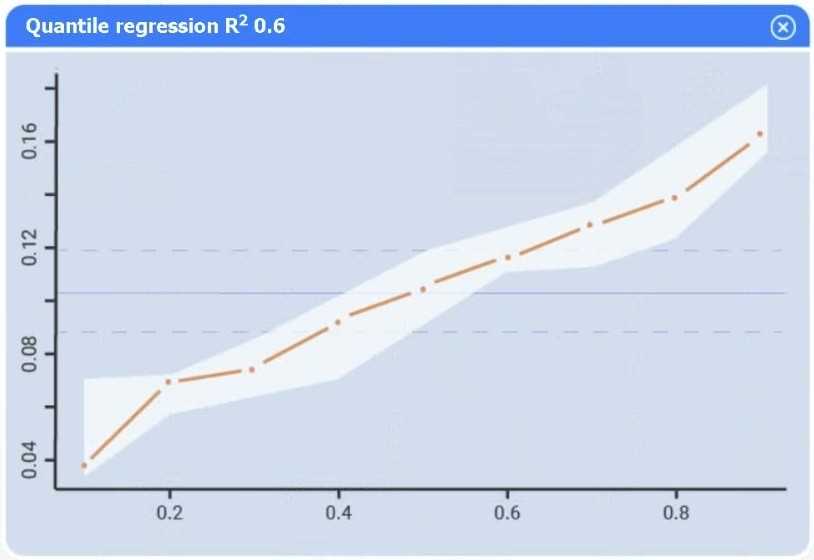
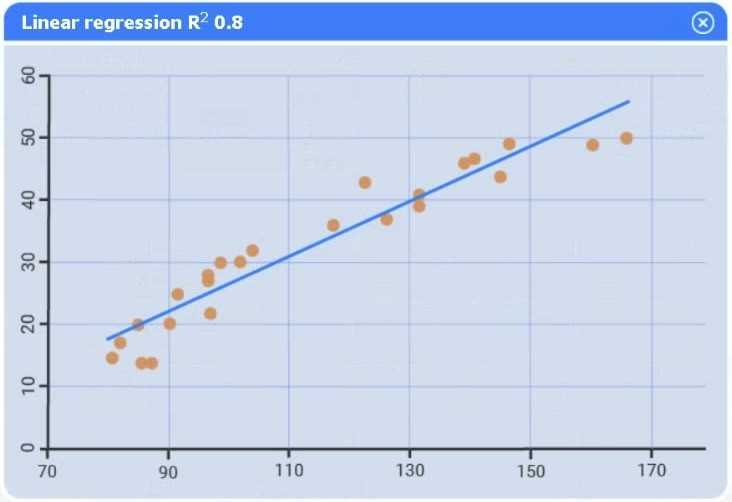
I agree Model C seems solid, but I’d also check residual plots if available to confirm assumptions. Sometimes a variable looks significant statistically but messes with model diagnostics.
Option C looks best; variables with p > 0.05 can be dropped next.
the following types of models is the best for explaining this type of growth?
Probably D since bacteria multiply by doubling, fitting exponential growth.
D, because growth rate depends on current population, not a fixed addition.
B, because naive Bayes assumes features are conditionally independent given the class.
Yeah, it's about assuming all features are independent when conditioned on the class, which is option B. This assumption makes the math easier but isn't always true in real data. B
is the best way to accomplish this objective?
B/C? LEFT and RIGHT OUTER JOIN both include all rows from one table plus matching rows from the other, so they still pull more data than INNER JOIN but less than FULL OUTER JOIN. If the question is about the absolute most data, FULL OUTER JOIN (D) makes sense, but if you’re considering performance or relevance, one sided outer join might be enough. Since they didn’t specify table relationships or size, I’d say FULL OUTER JOIN is most thorough, but LEFT or RIGHT are decent middle grounds depending on which table’s data you prioritize.
B imo, LEFT OUTER JOIN keeps all from one table plus matches, often more than INNER JOIN.
method without complex, in-depth training from the historical data set. Which of the following
methods would best serve this purpose?
It’s C because Naive Bayes is known for quick training and clear probabilistic output.
A/C? Logistic regression is also probability-based and simpler than random forests, but it might need more training effort than Naive Bayes. Naive Bayes still seems best for minimal training and probabilistic output.
A data scientist is working with a data set that covers a two-year period for a large number of machines. The data set contains:
Machine system ID numbers
Sensor measurement values
Daily time stamps for each machine
The data scientist needs to plot the total measurements from all the machines over the entire time period. Which of the following is the best way to present this data?
B imo, because the data spans over time and we want to see trends or changes in totals. Scatter plots or histograms don’t show that progression as clearly. Box plots don’t capture daily totals well here.
A/B? Scatter plots (A) are usually better for showing individual data points or relationships, but since we want to see total measurements over time, a line plot (B) seems more straightforward. Histograms (C) don’t really fit here because they show frequency distributions, not trends over time. Box plots (D) summarize data distributions but won’t show how totals change day by day. So between A and B, B feels like the best choice to capture how measurements evolve across the time period.
features more useful when building a model. Which of the following data transformation techniques
should the data scientist use? (Choose two.)
B/D? One-hot avoids any rank assumption, while label encoding turns categories into numbers for models that can handle ordinal data. Other choices like normalization don’t fit categorical variables at all.
B and D. One-hot encoding is great for nominal categories to avoid implying order, while label encoding can work if the categories have a meaningful order. The other options either don’t apply to categorical data or are more about scaling numerical features.
previous day's sales volume. Which of the following resource constraints is the data scientist's
greatest concern?
A. Deployment time matters here because even if you have the data collected and the model trained, if it takes too long to push the updated prices live, the system won’t be truly responsive. The whole point is quick updates based on yesterday’s sales, so delays in deployment could bottleneck the process more than training or data collection once those are done on schedule. Without fast deployment, daily price changes lose their value.
I get why data collection time (D) is important, but I’m thinking training time (B) could be the bottleneck here. If the model has to completely retrain every day with new sales data, that could slow things down more than deployment. Quick deployment is needed, sure, but if the model isn’t ready because it’s still training, prices won’t update on time. So I’d pick B.
A data scientist is preparing to brief a non-technical audience that is focused on analysis and results. During the modeling process, the data scientist produced the following artifacts:
Charts and dashboards
Model performance statistics (accuracy, precision, recall, F1 score, etc.)
Mathematical descriptions of clustering algorithms included in the selected model
Model selection, justification, and purpose
Code documentation
Data dictionary
Which of the following artifacts should the data scientist include in the briefing? (Choose two.)
It’s A and B for me. The charts and dashboards (A) are the easiest way to communicate results visually, and the model selection with justification (B) helps the audience understand why that approach was taken without getting too technical. Performance stats (E) might be too detailed for a non-technical crowd, and things like code or math (C and D) are definitely out. The data dictionary (F) feels unnecessary unless they specifically asked about data definitions, which they didn’t here.
I’d drop C and D for sure; non-tech folks won’t follow code or math. So, A and B.
of the conglomerate company. Nothing in the data differentiates the data observations for the
different businesses. Which of the following is the most efficient way to identify the chemical
businesses' observations?
It’s C. Getting info straight from the business team avoids wasting time on irrelevant data and ensures you focus only on the chemical operations, which seems way more efficient than guessing or sifting through everything.
B imo. If the data isn’t labeled at all, analyzing everything and then filtering for chemical-related results might actually save time compared to waiting on input or guessing which data is relevant.
Errors going backward is key here, so D fits best. A’s about convolutions, which only apply to certain networks, so it’s too narrow. The others don’t really mention the core idea of error propagation.
Probably D. Backpropagation is all about sending the error signals backward through the network to adjust weights. A mentions convolutions, but that’s specific to CNNs and doesn’t capture the general idea. B talks about accuracy which isn’t really propagated backward, and C’s mention of nodes passing backward doesn’t fit the standard process. So D fits best by describing errors moving back to update parameters.
historical accuracy of the model is 90%. At a specific factory, the model is reporting a likelihood score
of 0.90. Which of the following explains a confidence score of 0.90?
It’s A. The 90% accuracy refers to the model identifying errors correctly across known cases, not repeated runs or samples. So the confidence score likely means it expects to catch 90 out of 100 issues overall.
It’s C because it matches the idea of the model predicting errors repeatedly on the same factory. D talks about runs but framing it as error predictions fits better with C.
It’s A because PCA transforms data into fewer components without losing much info, which is exactly what dimensionality reduction is about. The other options are more about what you do with data after reducing it.
It’s A because PCA aims to reduce the number of features while preserving as much variance as possible. It’s not designed for tasks like classification, regression, or recommendation—those require different algorithms. PCA helps simplify data sets to make other analyses easier or more efficient, so dimensionality reduction fits perfectly here.
from the tables below. The resulting data must show all movies in Table 1, enriched with actors listed
in Table 2.
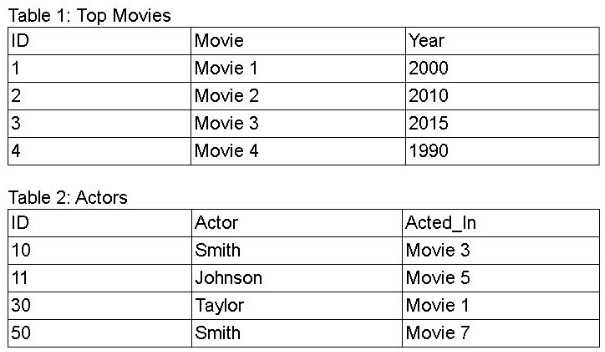
Which of the following query operations achieves the desired data set?
B doesn’t make sense since UNION just stacks rows, not combine columns. It won’t link actors to their movies, so it can’t enrich the data as required.
D, since UNION or INTERSECT don’t combine columns like JOIN does.