Free CompTIA DataX DY0-001 Actual Exam Questions - Question 2 Discussion
SIMULATION
A data scientist needs to determine whether product sales are impacted by other contributing factors. The client has provided the data scientist with sales and other variables in the data set. The data scientist decides to test potential models that include other information.
INSTRUCTIONS
Part 1
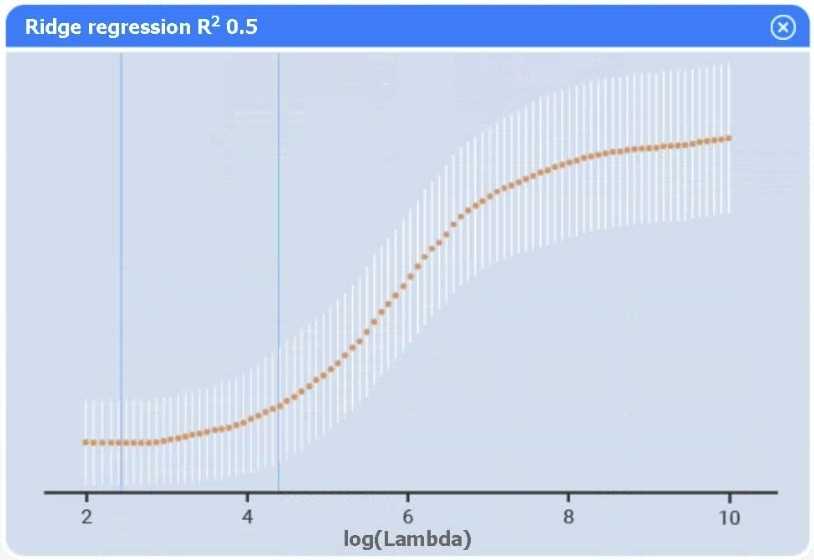
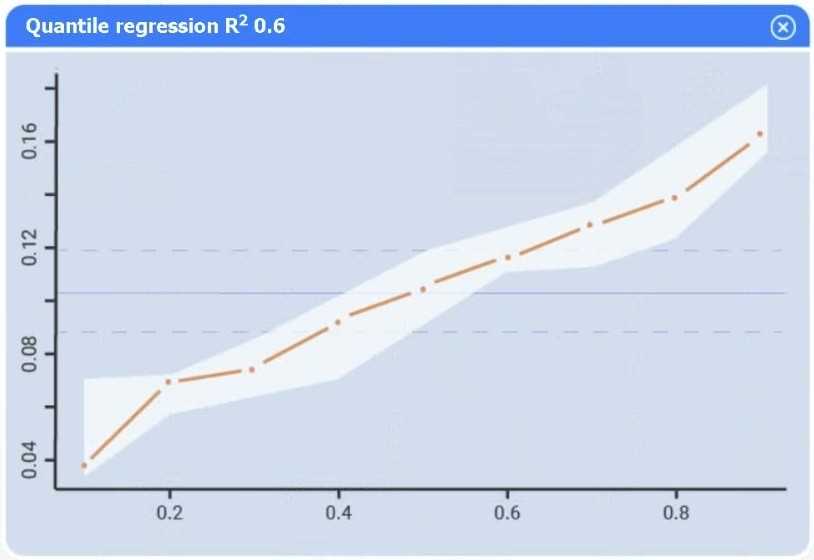
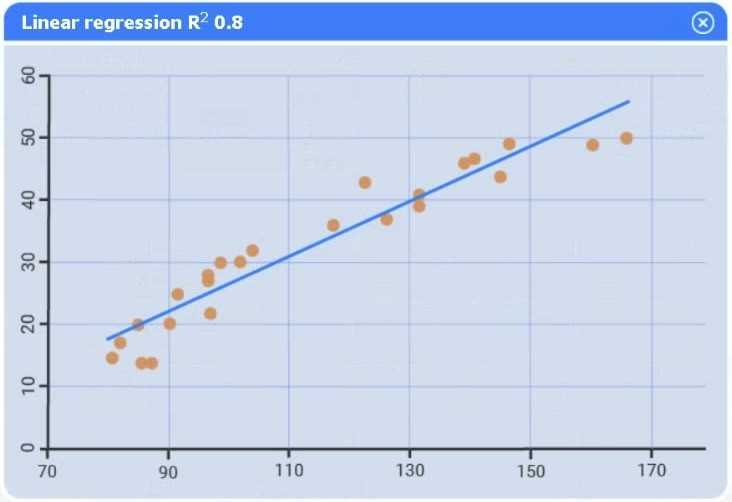
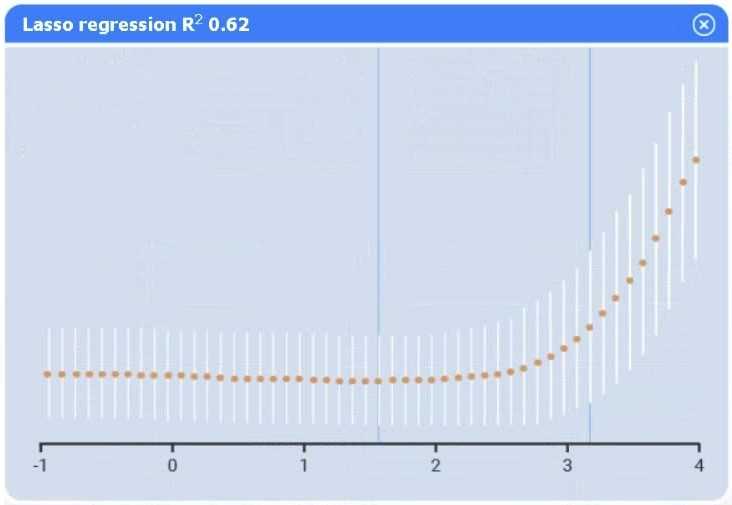
Use the information provided in the table to select the appropriate regression model.
Part 2
Review the summary output and variable table to determine which variable is statistically significant.
If at any time you would like to bring back the initial state of the simulation, please click the Reset All button.
I agree Model C seems solid, but I’d also check residual plots if available to confirm assumptions. Sometimes a variable looks significant statistically but messes with model diagnostics.
Option C looks best; variables with p > 0.05 can be dropped next.
Model C might have the best fit, but if any variables have p-values above 0.05, they probably aren’t really influencing sales. I'd drop those before finalizing the model choice.
Model C's adjusted R² is better, but I’d double-check if any variable's p-value is above 0.05 before deciding. A variable can look important in the model but still not be statistically significant.
Model C’s adjusted R² stands out, but I’d check if any variables have high p-values despite that. Even a strong model can have insignificant predictors, so focusing on variables with low p-values is key here.
Model C’s adjusted R² is highest, so it likely explains sales best.
Model C looks solid, but I'd also consider Model A since its variables have lower p-values than B, making it more reliable than B but less complex than C. Good middle ground if simplicity matters.
I’m with you on Model C, but also noticed the p-values for variables in Model B are higher, which makes it less reliable. Model C’s variables show stronger significance, so it’s a safer bet overall.
Model C definitely seems solid, but I’d also consider the adjusted R-squared since it balances model fit and complexity. If it’s highest there, that’s another point for C.
Model C looks best because it includes relevant factors without adding noise. Plus, the p-value for one variable is clearly below 0.05, so it’s statistically significant.
C