Free COMPTIA Data+ DA0-001 Actual Exam Questions
Dumps Box (DumpsBox) offers up-to-date practice exam questions for DA0-001 certification exam which are developed and validated by CompTIA subject domain experts certified in COMPTIA Data+ DA0-001 . These practice questions are update regularly as we keep an eye on any recent changes in DA0-001 syllabus, and when there is update our team quickly adjusts the questions. This commitment to providing the best quality exam prep material to certification aspirants is what makes DumpsBox.com the best certification exam prep website. On top of that, our strong, yet strictly moderated, community based feedback keeps the content clean and current. Each question has helpful community discussion that provides it extra perspective and introduces helpful resources for better exam preparation. This also saves students from other outdated practice questions or illicit exam dumps that can have adverse affects on career. Browse through our COMPTIA Data+ DA0-001 exam questions and pass your exam on first try.
B, Excel’s drag-and-drop charts make quick visuals easy without much setup.
Option B seems solid since Excel is widely used for quick, straightforward visualizations and has built-in features that speed up the process compared to tools mainly designed for data processing.
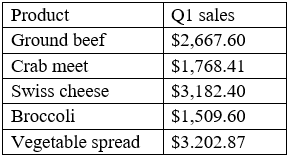
Which of the following is the mean?
I’m thinking B is the answer because it balances the smaller sales and a few higher ones without jumping too high like C or matching the total D. So, B.
A, because the mean should be closer to the majority of Q1 sales, which cluster around 2,000.
profitability for her company.
Which of the following systems is the most appropriate?
True, but C is the backbone that makes B possible; without integrated data, OLAP can’t function well. C
It’s C because a data warehouse combines all the different data sources Taylor needs for a complete profitability analysis, unlike OLAP that depends on having that data already organized.
300, 430, 170, 470, 600
Which of the following is the mean height for the five dogs?
Option A seems right since the sum is 1970, dividing by 5 gives 394 exactly. The other options are way off for that total.
Makes sense to me that it’s A. Another way to check is by approximating: the middle height looks around 400, and since we have a couple of dogs above and below that, the mean should be near 394. The really tall 600mm dog pulls it up a bit but not enough to hit values as high as C or D. So yeah, A fits best with just a quick mental check too.
group of customers, and an old website was presented to a control group. The table below shows the
percentage of users in each group who made purchases on the websites:
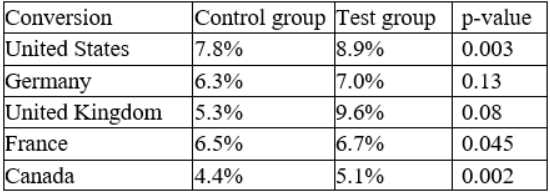
Which of the following conclusions is accurate at a 95% confidence interval?
It’s A. The table shows Germany’s conversion rate barely changed between old and new layouts, so that increase isn’t statistically significant at 95%. France and the overall numbers seem to have clearer improvements, so B and C don’t fit as well. Also, D is off because the UK’s new layout conversion isn’t the lowest compared to the others. Focusing on Germany makes the most sense for this question about significance.
A/D? The question is about significance at 95%, and from the table, Germany’s increase is minimal, so A feels right. D says UK has the lowest rates with the new layout, but looking closely, UK’s rates don’t seem the lowest overall. So I’d rule out D. The overall trend (C) is tempting but without exact stats, hard to confirm significance generally. A seems safest if we focus on where no significant change happened.
54, 54, 54, 55, 56, 57, 57, 58, 58, 60, 60
This tables show a simple frequency distribution of the retirement age data.
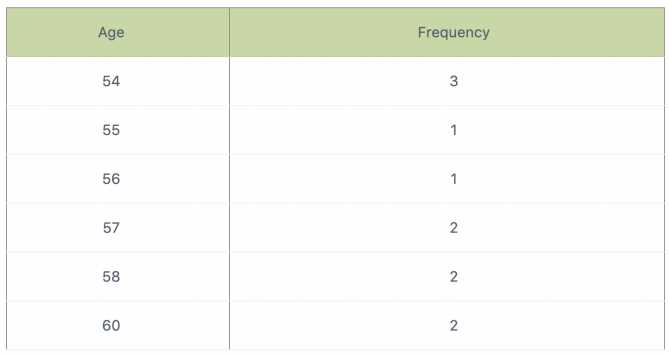
D vs C? The dataset clearly shows 54 appears three times, while 57 only appears twice. Since the question references a simple frequency distribution, it’s probably about the mode, which is the value that shows up most often. So 54 (D) makes more sense than 57 (C). The other options have fewer repeats. Without any mention of mean or median, mode is the safest bet.
D imo, since 54 appears the most times, it’s the mode, which is what the frequency table highlights. The question’s not clear, but mode fits best with the data shown.
datapoints. Which of the following is the BEST type of analysis to conduct?
C, because it directly examines relationships between data points.
D vs C? Exploratory analysis helps find patterns without prior assumptions.
into a data warehouse.
In what phase are the group's R skills most relevant?
B tbh, the loading phase can involve R for validating and formatting data before it hits the warehouse, not just extraction or transformation. So their skills might be crucial there too.
C/A? While extraction might involve grabbing raw data, R’s real strength is in transforming and cleaning data sets, making C the most fitting phase for R skills over just pulling data in A.
A vs D? Passport is standard, but credit card with photo/signature might be too unofficial.
Maybe D could be acceptable since it has both a photo and signature, which are key for verifying identity. A passport is definitely the safest bet, but credit cards with photo and signature might work if the exam rules are flexible. The school or employee IDs usually don’t have a signature and aren’t always government-issued, so probably less likely to count as primary.
the sensitive nature of the government the does il with, some account information is not shown.
Which of the following fields should be masked?
D imo because customer names are definitely sensitive, especially with government clients. Even if other data like sales volume or start date is less personal, the name directly identifies the client, which usually requires masking. Plus, product names and sales volumes are generally business info, not personal. So D fits the usual privacy rules best here.
Option D seems likely, but what’s the exact sensitivity policy here?
should perform with the data?
Maybe D since Pareto charts highlight key issues quickly without deep data digging.
A. Starting with exploratory analysis and descriptive stats gives a broad, quick overview of the data’s characteristics without assuming anything about its type or structure. It's the most basic first step before specialized charts.
scale of 0 to 1.
What term describes this action?
B. Another way to think about it is that normalization adjusts the data to a common scale without distorting differences in the ranges of values. Filtering would be cutting out data points, which isn’t what’s happening here, and transposition is just flipping data orientation. Aggregation combines data points, so that doesn’t fit either. So, scaling variables to 0-1 is definitely normalization.
I get why normalization (B) is a strong pick since it’s about adjusting values to a standard scale. Another angle: filtering (A) usually means selecting or removing data, not changing values. Transposition (C) flips rows and columns, so definitely not about scaling. Aggregation (D) combines multiple data points, which isn’t what’s happening here either. So, does anyone think there’s a reason to question normalization given these definitions?
sales.
Which of the following systems is the most appropriate?
Choose the best
If Alex needs prediction, a BI system (option B) usually combines all data and analytics best.
I’d rule out ERP since it’s more about operations, not prediction. BI systems do the predictive stuff using integrated data, so option B sounds like the best fit here.
The director of operations at a power company needs data to help identify where company resources
should be allocated in order to monitor activity for outages and restoration of power in the entire
state. Specifically, the director wants to see the following:
* County outages
* Status
* Overall trend of outages
INSTRUCTIONS:
Please, select each visualization to fit the appropriate space on the dashboard and choose an
appropriate color scheme. Once you have selected all visualizations, please, select the appropriate
titles and labels, if applicable. Titles and labels may be used more than once.
If at any time you would like to bring back the initial state of the simulation, please click the Reset All
button.
Using a choropleth map for county outages gives a quick visual of affected areas, and a line chart for trends clearly shows changes over time. For status, a horizontal bar chart could work well to compare categories side by side.
Using a map for county outages is definitely the way to go since it shows geographic spread clearly. For status, a stacked bar chart might be better than a pie chart because it’s easier to compare categories side by side. Line chart for trend makes sense since it highlights changes over time. For colors, I’d pick bold contrasting colors—like red for outages and green for restored—to make the status obvious at a glance. Keeping it simple but clear seems key here given the operational focus.
While performing an initial quality check, she realizes that her employee ID is not associated with her
identifier in the CRM system.
What kind of issues is Angela facing?
Choose the best
This seems like a classic case of a key mismatch issue. If the IDs aren’t linking, it might mean there’s no shared primary key or the mapping table is incomplete, causing the data not to join correctly.
I think this sounds like a referential integrity issue. Since the employee ID isn’t linked to the CRM identifier, it’s probably because the data isn’t properly matched or synchronized across systems. It’s not just about formats but about missing connections between related records. So the problem is that these two datasets aren’t joined correctly, causing gaps in identification.