Free COMPTIA Data+ DA0-001 Actual Exam Questions - Question 2 Discussion
Which of the following is the mean?
I’m thinking B is the answer because it balances the smaller sales and a few higher ones without jumping too high like C or matching the total D. So, B.
A, because the mean should be closer to the majority of Q1 sales, which cluster around 2,000.
C imo, since some sales are well above 3,000, the average should be higher than A or B, but definitely not as high as D which looks like the total sum.
Maybe A makes sense since the total is definitely D and C is too high for a mean. The smaller Q1 values mostly hover around a couple thousand, so A fits better as an average.
B tbh, if you eyeball the numbers, a simple average should be a bit higher than A but nowhere near D or C. B seems like a plausible middle ground when you consider a few larger sales pulling the average up.
Yeah, D is clearly the total sum, so it’s out. B seems a bit inflated given the smaller values shown. So A looks like the most reasonable average here.
A seems right here since the total (D) is far too large, and C probably represents sum totals. B looks a bit off compared to the smaller sales figures, so A fits the typical average range better.
Option C could be the right pick if you think about it being an average of the larger sales regions or some weighted mean, not just a simple average. A and B seem low if you consider that some entries are quite a bit above $3,000. D is definitely out since it’s way too high to be an average—it looks more like a total. So, if the question implies averaging all Q1 sales including higher values, C might actually fit better.
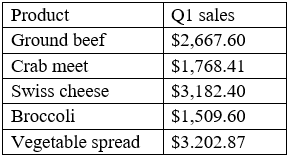
I’m sticking with A on this one. The total sales figure (D) is definitely too large to be the mean, and C feels like a sum rather than an average. Also, B seems a bit high when you consider the individual Q1 entries; the numbers mostly hover around the low thousands. So $2,466.18 fits better as a reasonable average for Q1 sales here.
It’s A, because D looks way too high and C seems like total sales, not average.
Going with B here. Adding all Q1 sales and dividing by the number of entries looks closest to $2,667.60. The others seem off when eyeballing the numbers. Anyone else think the same?