Free Microsoft Power Platform PL-900 Actual Exam Questions - Question 4 Discussion
DRAG DROP A company is implementing Power BI to track sales. Each of the company’s regions has specific quarterly and yearly sales goals. You need to build a Power BI dashboard for various reporting requirements. Which chart types should you use? To answer, drag the appropriate chart types to the correct requirements. Each chart type may be used once, more than once, or not at all. You may need to drag the split bar between panes or scroll to view content. 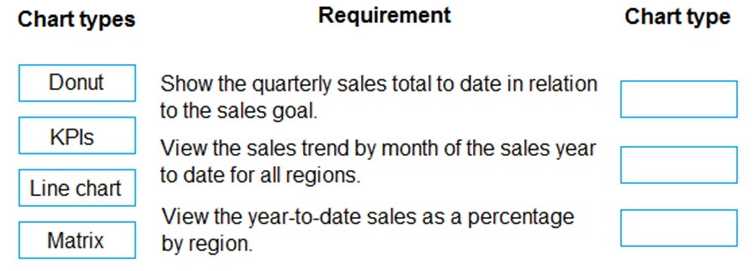
I’d ditch combo charts since they can get messy. Line charts for quarterly trends make sense, but bars are simpler and clearer for yearly totals. So B for quarterly and A for yearly sounds right to me.
I think option C might be a trap here because it looks good but doesn’t show trends over time as clearly. Maybe a line chart for quarterly goals and bar charts for yearly ones? Not sure if they want combo charts too.