Free Microsoft Power BI PL-300 Actual Exam Questions - Question 8 Discussion
HOTSPOT You have a column named UnitslnStock as shown in the following exhibit. 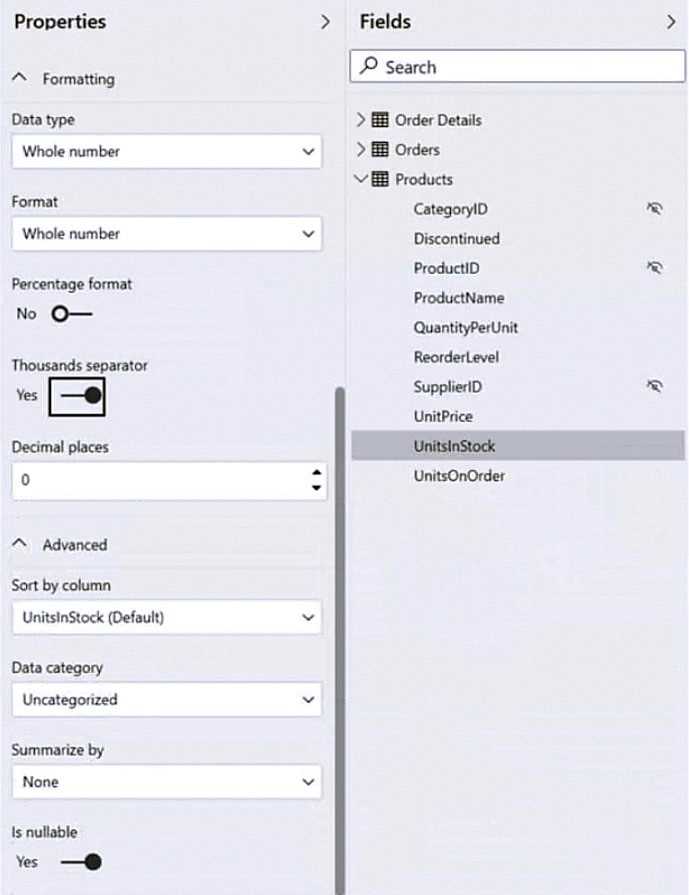 UnitsInStock has 75 non-null values, of which 51 are unique. Use the drop-down menus to select the answer choice that completes each statement based on the information presented in the graphic. NOTE: Each correct selection is worth one point.
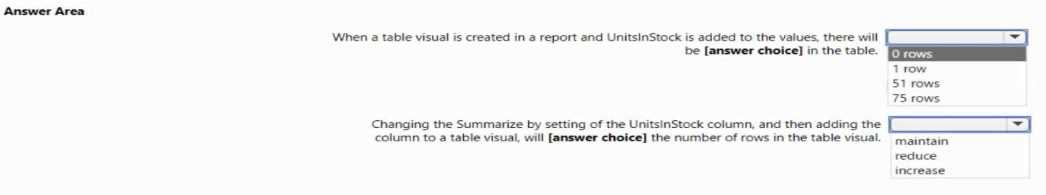
With 51 unique values among 75, there’s a lot of variety, making mode less useful. Median might better represent the center since it’s less affected by any extreme values than the mean would be.
Since there are 75 values and 51 unique ones, the data isn’t tightly clustered, so mode or median might not represent it well. I’d focus more on mean or just acknowledge the spread for better context.
I think the key here is focusing on what the unique values tell us. Since 51 out of 75 are unique, the data seems pretty spread out, which makes me doubt using the mode as the measure of central tendency. Also, because there’s no info on how data is skewed, median feels like a safer bet than mean since median isn’t affected by extremes. So I’d say the statement about central tendency should lean towards median rather than average or mode. The high uniqueness also supports that the most frequent value (mode) won’t represent the data well.
Definitely rules out B, since 51 unique values means a lot of variety in UnitsInStock. I think it’s more about median or average here, so not sure if C fits well.