Free Microsoft Power BI PL-300 Actual Exam Questions - Question 4 Discussion
DRAG DROP You have the line chart shown in the exhibit. (Click the Exhibit tab.) 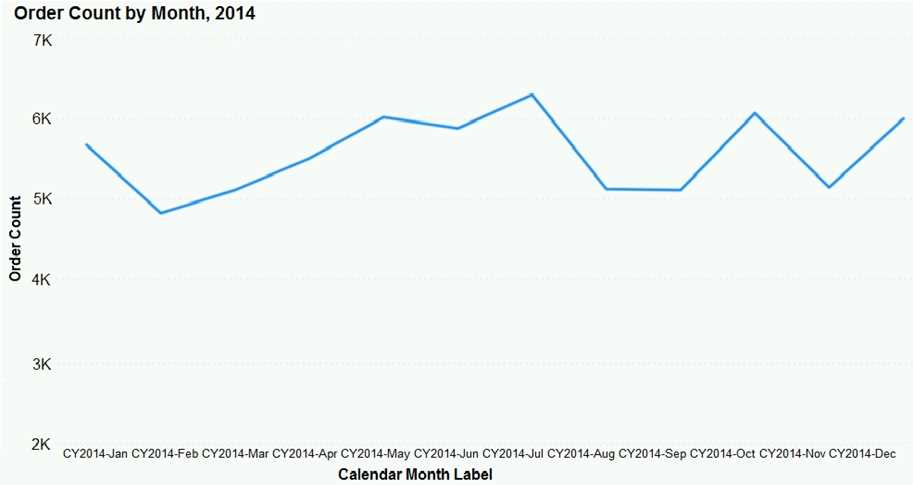 You need to modify the chart to meet the following requirements: Identify months that have order counts above the mean. Display the mean monthly order count. Which three actions should you perform in sequence? To answer, move the appropriate actions from the list of actions to the answer area and arrange them in the correct order.
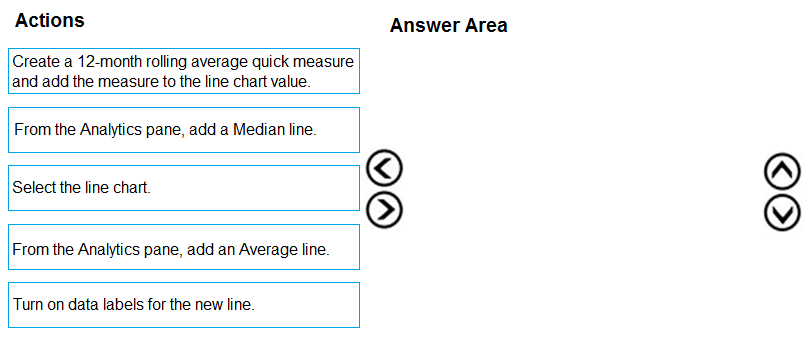
Starting with D to create the mean measure is a must since you need that value for the rest. Then A to display it visually, and finally C to highlight the months above that mean makes sense.
I’m thinking the key is to actually create a mean measure first, which would be option D. Without that, you can’t highlight months above the mean correctly or add a dynamic line. Then adding the mean line (A) makes sense so it shows the average on the chart. Finally, highlight the months above the mean (C) to complete the requirements. This way, you have a clean flow of defining the metric, displaying it, then using it for conditional formatting.
I think you need to start with creating the mean measure (D) because without that, you can’t really highlight months or add a correct reference line. After that, adding the line (A) makes the mean visible on the chart. Finally, you highlight the months above the mean (C). The order matters since highlighting depends on having the measure ready, and the line is more of a visual aid once the measure exists. Skipping straight to adding a reference line or highlighting without the measure first won’t work properly.
I’m skipping option B because it just adds a reference line without creating a measure we can use. So better to first create the mean measure (D), then add the line (A), and finally highlight months (C).
First calculate mean (B), add line for mean (A), then highlight months (C).
I think starting with calculating the mean (B) makes sense because you need that value first. Then adding the mean line (A) helps visualize it on the chart. Finally, using conditional formatting or a filter (C) to highlight months above the mean fits well as the last step since it depends on having the mean line in place already. This order feels logical and matches how you’d build it step-by-step in Power BI.
B, A, C