Free Microsoft Dynamics MB-700 Actual Exam Questions - Question 4 Discussion
DRAG DROP A company uses Dynamics 365 finance and operations apps. The company creates its performance monitoring strategy. The implementation has complex modifications and data intensive processes that create deadlocks. You need to recommend tools for the company to use to monitor performance. Which tools should you recommend? To answer, drag the appropriate tools to the correct performance questions. Each tool may be used once, more than once, or not at all. You may need to drag the split bar between panes or scroll to view content. NOTE: Each correct selection is worth one point. 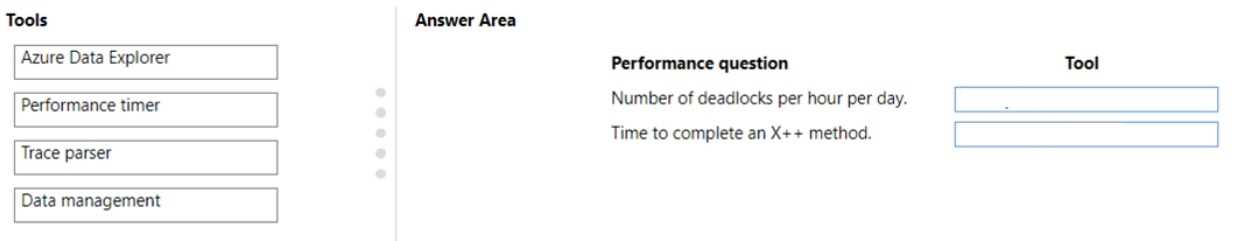
If the environment is cloud-based, Extended Events is usually better than SQL Profiler because Profiler isn’t supported in Azure SQL. For deadlocks, Extended Events captures detailed info with less overhead. Performance Monitor remains useful to watch CPU and memory spikes caused by the heavy data processes. Also, Application Insights can help monitor app-layer issues beyond just SQL deadlocks, so it’s worth using for user experience and custom events. I’d skip SQL Profiler here unless the setup is strictly on-prem since it’s mostly legacy now.
SQL Profiler fits well for tracking deadlocks in on-prem setups here.
Another thing is, for deadlocks, Trace Parser can also help by analyzing the trace logs generated by SQL Profiler or Extended Events, giving a clearer picture of the locking issues. As for monitoring overall app performance, Application Insights might be useful to track errors and response times from the business logic side, especially with complex customizations. So I’d pair SQL Profiler or Extended Events with Trace Parser for deadlock troubleshooting and use Performance Monitor or Application Insights for tracking data-intensive processing performance.
I think for deadlocks, SQL Profiler is the go-to because it captures the actual SQL queries causing the locks. But for monitoring complex data-heavy processes, I’d suggest using Performance Monitor to watch CPU, memory, and IO usage since these processes can strain resources beyond just SQL. Also, Application Insights could help track performance trends from the app side, giving a broader picture beyond just the database layer. So mixing SQL Profiler with Performance Monitor and maybe Application Insights covers both detailed deadlock info and overall system health.
I agree that SQL Profiler is great for deadlock analysis, but for monitoring overall database performance and troubleshooting data-intensive processes, I’d also consider using Extended Events. It’s more lightweight and efficient than Profiler, especially in newer environments. For system-level metrics like CPU and memory usage, Performance Monitor definitely fits. So basically, SQL Profiler or Extended Events for deadlocks and query-level monitoring, and Performance Monitor for hardware resource tracking. The question seems to want a combo that covers both detailed SQL tracing and overall syst
SQL Profiler is great for deadlock diagnostics because it tracks detailed SQL activity. For broader system resources like CPU and memory, Performance Monitor fits better since it gives a hardware-level view.
I’d say SQL Profiler is definitely solid for catching deadlocks since it tracks SQL events closely. Also, for overall system performance and tracing, Performance Monitor makes sense because it shows CPU, memory, and other resource usage. I wouldn’t pick something like Lifecycle Services here since that’s more for deployment and environment setup. So for deadlocks and data-heavy processes causing bottlenecks, SQL Profiler and Performance Monitor feel like the right mix.
seen similar Q about deadlock tools, thinking SQL Profiler might be key here.