Free Microsoft Dynamics MB-230 Actual Exam Questions - Question 4 Discussion
HOTSPOT You view the interactive dashboard in the Microsoft Dynamics 365 Customer Service Hub. 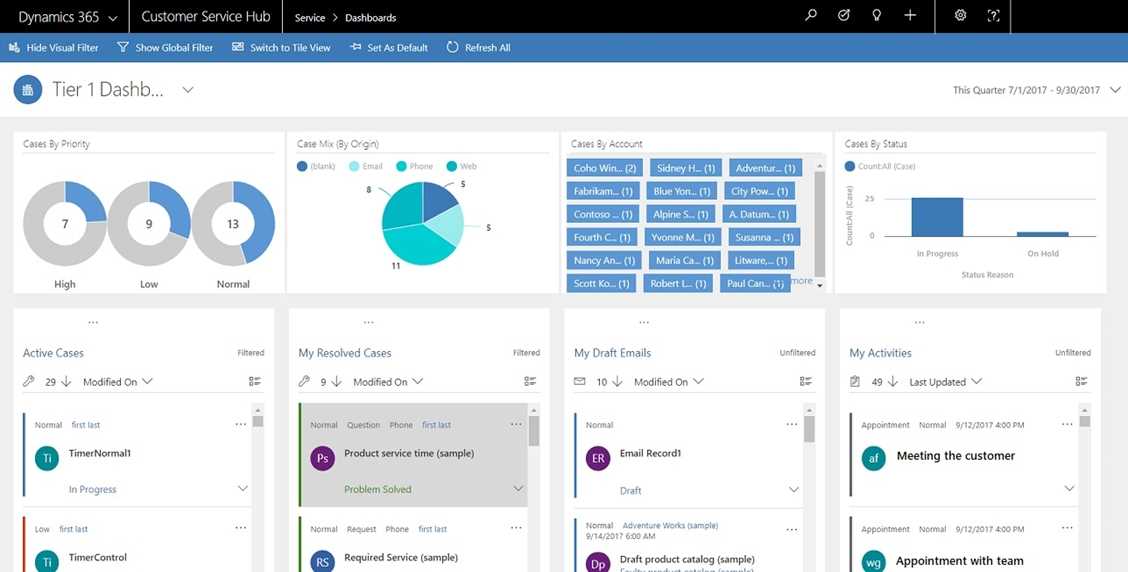 Use the drop-down menus to select the answer choice that answers each question based on the information presented in the graphic. NOTE: Each correct selection is worth one point.
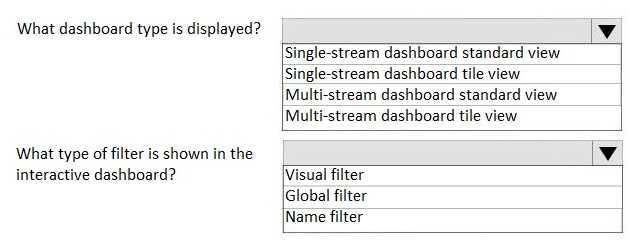
The top chart looks like a case type breakdown since it has categories like product issue and inquiry. For the time-based graph, I’d pick “Average Resolution Time” because it tracks duration trends, not just counts.
For the last dropdown, I think it shows "Average Resolution Time" because the graph has time on the Y-axis and dates on the X-axis, which matches tracking resolution trends over time rather than just case count.
I think the top chart is definitely showing “Case Type” because it breaks down different case categories. For the second dropdown, “Open Cases by Channel” works since the middle chart seems to compare channels like phone and email. The last one is trickier, but the time-based line graph at the bottom most likely represents “Average Resolution Time” since it tracks how long cases take over months. The layout of the dashboard aligns well with these options, so this feels like the best fit overall.
Looks like the dashboard highlights case details pretty clearly. I’d say the first dropdown should be “Case Type” since that’s what the top chart is breaking down. For the second, “Open Cases by Channel” fits best with the middle graph showing communication channels. The last one should be “Average Resolution Time,” as it matches the bottom trend line on how long cases take to close. Hope that helps!