Free Microsoft Dynamics MB-230 Actual Exam Questions - Question 3 Discussion
DRAG DROP You are customizing a Dynamics 365 for Customer Service implementation. The call center manager requires a visual representation that includes the number of resolved cases by month for each call center agent. The chart must be visible to all users within the service area. You need to create the chart. Which three actions should you perform in sequence? To answer, move the appropriate actions from the list of actions to the answer area and arrange them in the correct order. 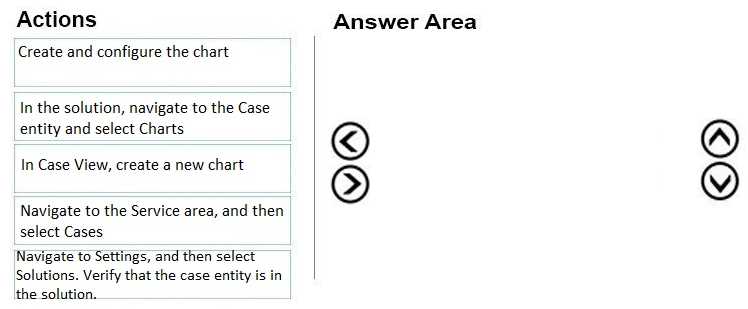
I think the key is creating the system chart first to make it available to everyone, as that’s a must. Then apply the filter for resolved cases so you’re only tracking ones that matter here. Last, grouping by agent and by month should give the clear visual breakdown the manager wants. If you don’t do it in this order, the data might not show correctly or be shareable across all users. Also, filtering before grouping helps keep the chart clean and focused on resolved cases only.
Start with system chart, filter by resolved cases, then group by agent and month.
Agree it has to be a system chart for everyone to see, then definitely filter by resolved status. Grouping by agent and month after that makes sense to break down the data visually.
Started with creating a system chart since it needs to be visible to all users. Then set the primary entity to Cases, filtered by status for resolved cases. Last, added the Agent as the legend and grouped data by month for the timeline. That should cover it in the right order.