Free Microsoft Azure DP-300 Actual Exam Questions - Question 13 Discussion
DRAG DROP Your company analyzes images from security cameras and sends alerts to security teams that respond to unusual activity. The solution uses Azure Databricks. You need to send Apache Spark level events, Spark Structured Streaming metrics, and application metrics to Azure Monitor. Which three actions should you perform in sequence? To answer, move the appropriate actions from the list of actions in the answer area and arrange them in the correct order. 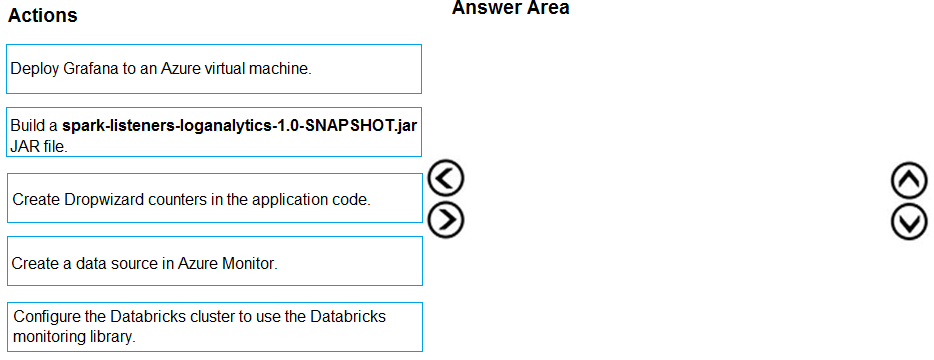
Agree, start with cluster diagnostic logs, then streaming metrics, finally send to Azure Monitor.
First thing’s to enable diagnostic settings on the cluster to catch Spark events. After that, configure Structured Streaming metrics tracking, and lastly, send all those logs and metrics to Azure Monitor.
I'd start by enabling diagnostic logging on the cluster to capture Spark events, then configure streaming metrics, and wrap up by routing those logs and metrics into Azure Monitor for centralized tracking.
I’d start with enabling diagnostic logs on the cluster to get those Spark events first. Next, set up Structured Streaming metrics since they’re part of the streaming job. Finally, send all this data to Azure Monitor for centralized tracking.
I went with starting by enabling Application Insights for the Databricks workspace because you need that as a base for monitoring. Then setting up Spark event logging through diagnostic settings comes next, so you capture all those detailed Spark events. Finally, you configure the streaming metrics to be pushed to Azure Monitor, since it depends on the earlier logging setup. This order makes sure you have the infrastructure ready before pushing specific metrics and logs.
I think the key is starting with enabling diagnostic logs on the cluster itself to capture Spark events, then configuring Structured Streaming metrics because they depend on the stream, and finally hooking those up to Azure Monitor to collect everything centrally.
First, enable diagnostic logging for Spark events, then set up Structured Streaming metrics, and lastly configure the integration with Azure Monitor to gather all metrics in one place.
This one’s tricky with all the monitoring layers involved. I’m guessing start by enabling event logging in Spark, then configure Structured Streaming metrics, and finally integrate with Azure Monitor for collecting app metrics. Not 100% sure though.