Free Qlik QSBA2024 Actual Exam Questions
Dumps Box (DumpsBox) offers up-to-date practice exam questions for QSBA2024 certification exam which are developed and validated by QLIK subject domain experts certified in Qlik QSBA2024 . These practice questions are update regularly as we keep an eye on any recent changes in QSBA2024 syllabus, and when there is update our team quickly adjusts the questions. This commitment to providing the best quality exam prep material to certification aspirants is what makes DumpsBox.com the best certification exam prep website. On top of that, our strong, yet strictly moderated, community based feedback keeps the content clean and current. Each question has helpful community discussion that provides it extra perspective and introduces helpful resources for better exam preparation. This also saves students from other outdated practice questions or illicit exam dumps that can have adverse affects on career. Browse through our Qlik QSBA2024 exam questions and pass your exam on first try.
continuous scale that includes a range. The measures will be Profit and Revenue.
Which visualization should the business analyst use?
a. The visualizations must meet several requirements:
A Bar chart that shows sales by product group is used in multiple sheets
• A KPI object that visualizes that the total amount of sales is used once
• A Treemap that shows margin by product group is used one time inside a Container
Which visualization should be added to the master items library?
total sales value for the year 2022, regardless of selections. Existing fields in the data model include
Sales and Year.
How should the business analyst write the measure for the KPI object?
• Projects may have co-dependent tasks and processes
• Some projects include subtasks
The business analyst needs to use a diagram similar to a workflow with the processes and the sub
tasks represented as boxes with lines to relate them to each other. The color of the boxes could also
be determined by the status of each project or task.
Which visualization should be used?
the image in Qlik Sense. The image shows charts for:
• Company employee structure
• Average employee salary by region
• Geographical representation of office capacity
• Company retention over time
Which charts will meet these analysis requirements?
analysis objectives, each customer will only use a subset of that data. Which procedure should the
business analyst follow?
There is data for the following countries under the field SACOUNTRY -> France, Spain, United
Kingdom and Germany. The application has been designed with Section Access to manage the data
displayed.
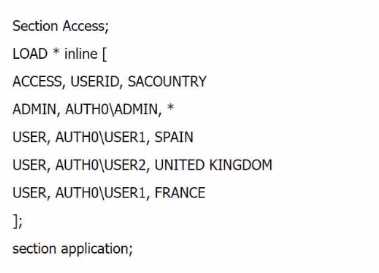
What is the expected outcome of this Section Access table?
fixed profit threshold. This visualization now needs to change so that the threshold can be defined by
the user. The user base is approximately 1000 heavy Excel users. These thresholds will be defined by
each user somewhat frequently, although the data changes only once per day.
Which action should the business analyst take to update this visualization?
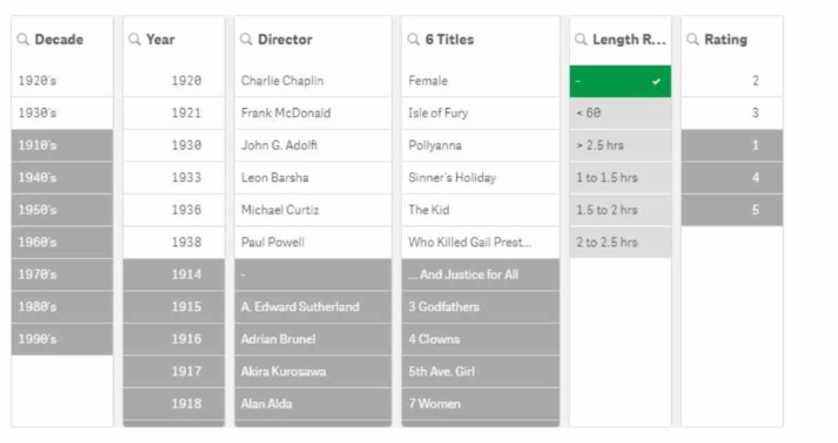
A movie analyst is using an app to gain insights into films created in the early 20th century. The
analyst reviews the filter for Length Range, notices a hyphen "-", and selects it.
What can the analyst determine from the resulting filter panes?
consists of the following fields: TransactionID, TransactionTime, Transaction Date, Transaction Year,
Cardholder, Cardholder address, Cardissuer, and Amount.
Users request to create an app based on this source with the following requirements:
• Users only review the data for the past 2 years
• Data must be updated daily
• Users should not view cardholder info
Which steps should the business analyst complete to improve the app performance?